Chart Book (6th edition): Industry Summary – Demographics of Business Owners in Construction and All Industries
7. Demographics of Business Owners in Construction and All Industries
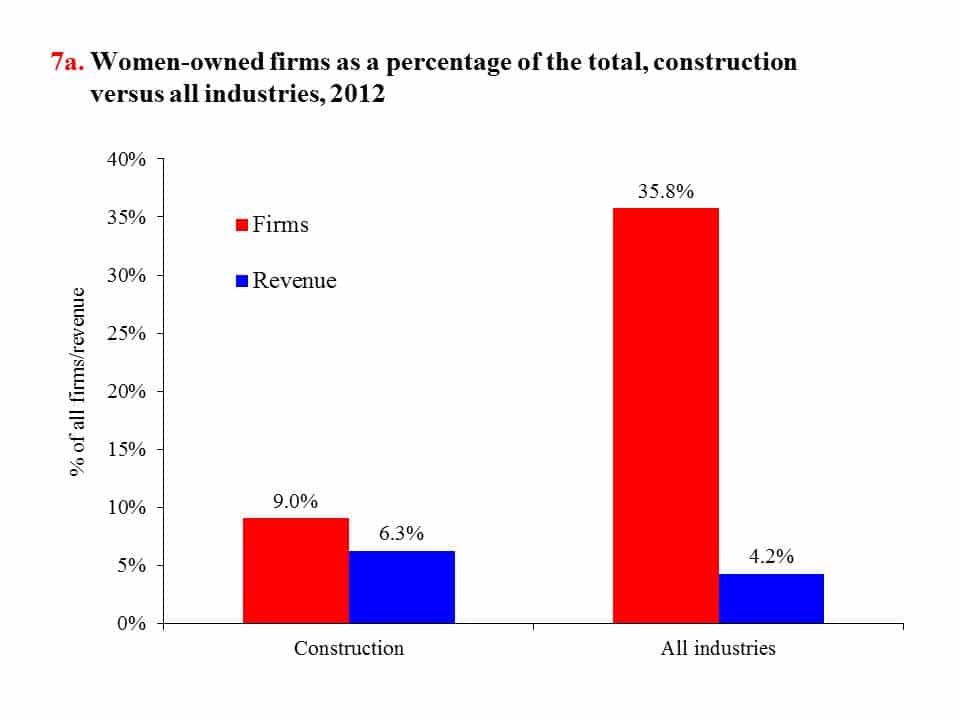
Demographic data on business owners are reported by the Survey of Business Owners (SBO), part of the Economic Census conducted by the U.S. Census Bureau every five years (most recently in 2012; see pages 2 and 3). In 2012, there were 2.9 million construction firms, the majority of which were owned by men.1 Roughly 7.4% were jointly male/female owned,2 and only 266,000, less than one out of ten (9.0%), were owned by women (chart 7a). The share of woman-owned firms in all industries, by contrast, is more than one in three (35.8%). However, women-owned firms in construction generated 6.3% of the construction industry’s revenue, compared to 4.2% for all U.S. industries.
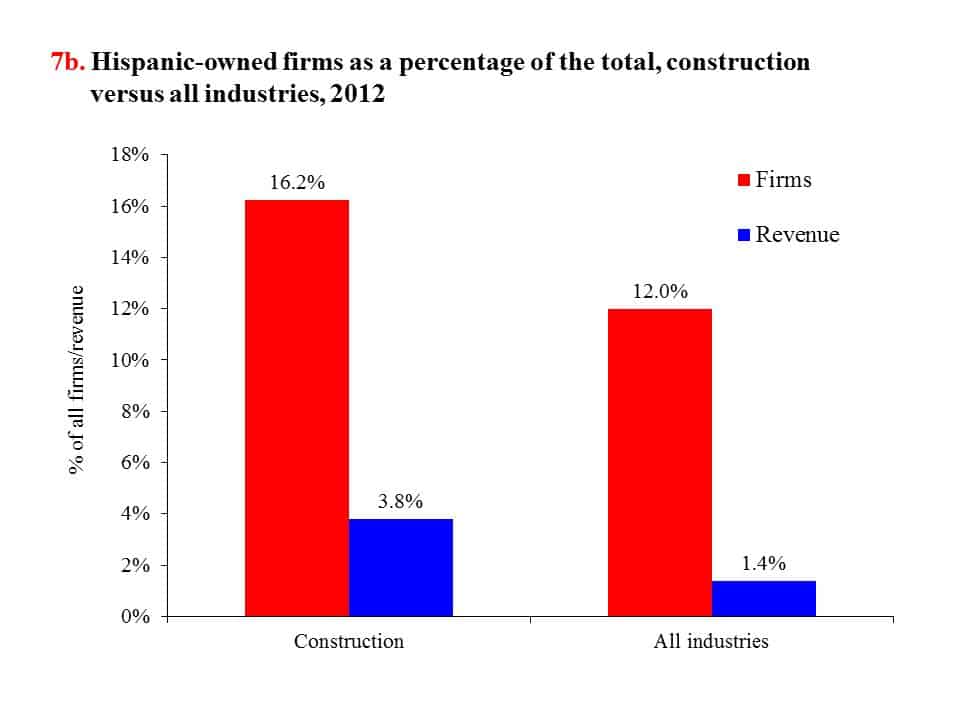
Hispanic-owned (see Glossary) firms accounted for 16.2% (475,000) of all firms in construction compared to 12.0% (3.3 million) of Hispanic-owned firms among all industries.1 However, Hispanic-owned firms only accounted for 3.8% of construction revenue and 1.4% of overall business revenue, respectively (chart 7b). These revenue numbers indicate that Hispanic-owned firms tend to be relatively small, especially among non-construction firms.
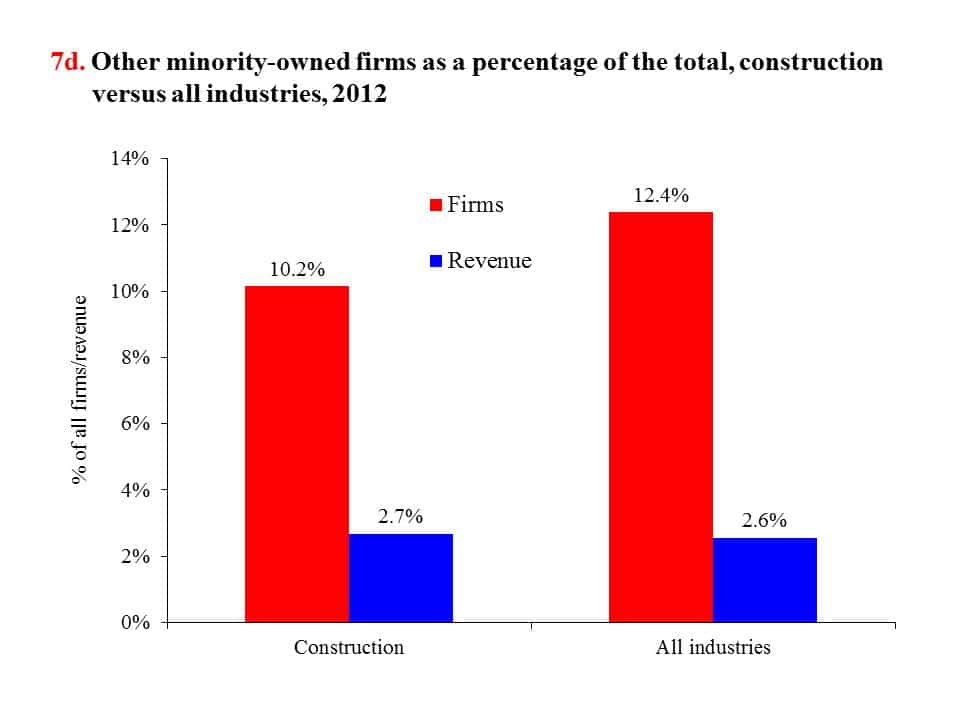
African American-owned firms accounted for less than one in ten (9.4%) of all firms in the U.S., but less than one in 20 firms (4.7% or 137,000 firms) in construction (chart 7c). Construction firms with African American owners produced less than 1% ($11.1 billion) of business revenue in this industry for 2012, close to the proportion for all industries combined. Other minority groups (Asian, American Indian or Alaska Native, Native Hawaiian or other Pacific Islander, and other groups) owned 10.2% (298,000) of construction firms with $39.8 billion in business revenue (chart 7d). These minority groups own a smaller proportion of construction firms, but they have a similar proportion of revenue compared to other industries.
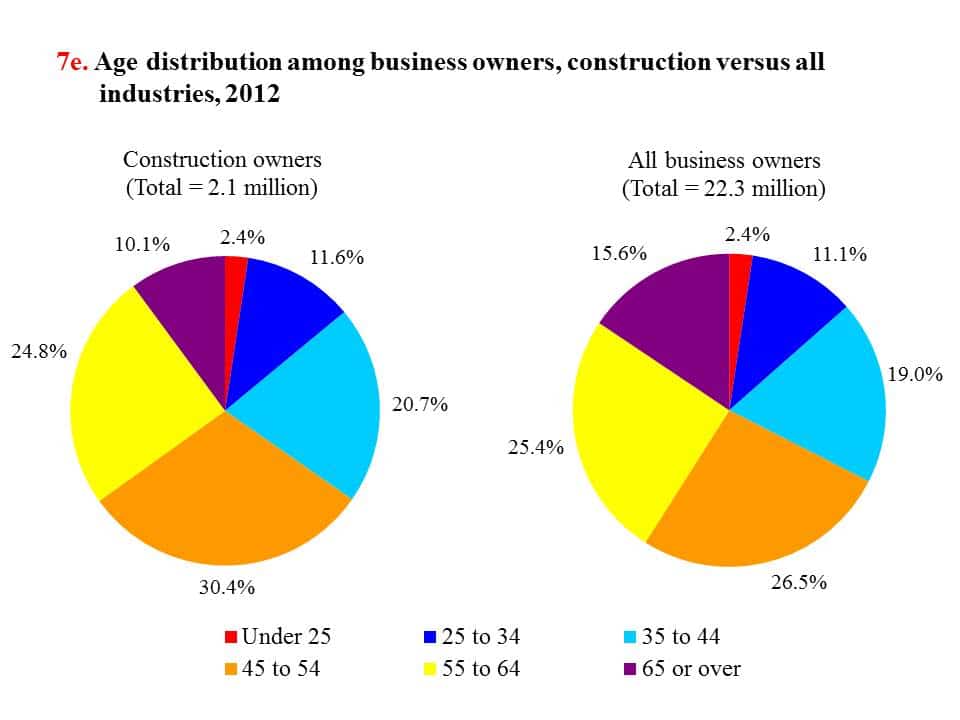
Construction owners tended to be younger than other business owners. About 35% of construction owners were under age 45, compared to 33% of all business owners (chart 7e). More than 40% of all business owners were 55 years or older, in contrast with 35% for construction owners. Among minority construction firm owners, this pattern may be even more pronounced; over half (52%) of Hispanic construction owners were younger than 45 years old.1
The SBO defines an owner as an individual or group of individuals having 51% or more of the stock, interest, or equity in the business, and categorizes this by gender, race, and ethnicity. Business owners were asked to provide the percentage of ownership for the primary owner(s), and to select one or more races or ethnicities to describe themselves. Therefore, it is possible for a business or owners to be classified and tabulated under more than one race or ethnicity category. The SBO is conducted on a company or firm basis, whereas data collected for the Economic Census are based on establishments. The SBO covers firms both with and without paid employees (nonemployer) by combining data from this survey with data from the main Economic Census and administrative records. Due to survey changes and variations in response rates among subgroups, the numbers are not comparable with data from previous surveys.
(Click on the image to enlarge or download PowerPoint or PDF versions below.)
Glossary:
Hispanic – From the Current Population Survey: persons who identified themselves in the enumeration or survey process as being Spanish, Hispanic, or Latino. Persons of Hispanic or Latino ethnicity may be of any race.
1. U.S. Census Bureau. 2012 Economic Census. Survey of Business Owners. (SB1200CSA01) https://www.census.gov/econ/overview/mu0200.html (Accessed March 2016). The figures on this page are based on the firms that are able to be classified by gender, race, ethnicity, and the revenue that these firms generated.
2. Equally male/female ownership was based on equal shares of interest reported for businesses with male and female owners.
Note:
All charts – Data cover the private sector only.
Chart 7a – Women-owned firms totaled 266,000 in construction and 9.9 million overall in 2012.
Chart 7b – Hispanic-owned firms totaled 475,000 in construction and 3.3 million overall in 2012.
Chart 7c – African American-owned firms totaled 137,000 in construction and 2.6 million overall in 2012.
Chart 7d – “Other minorities” include American Indian or Alaska Native, Asian, Native Hawaiian or other Pacific Islander, and some other race. Other minority-owned firms totaled 298,000 in construction and 3.4 million overall in 2012.
Chart 7e – Those that did not report age were excluded from the tabulation. Totals may not add to 100% due to rounding.
Source:
All charts – U.S. Census Bureau. 2012 Economic Census. Survey of Business Owners. (SB1200CSA01) https://www.census.gov/econ/overview/mu0200.html (Accessed March 2016).


