Chart Book (6th edition): Fatal and Nonfatal Injuries – Fatalities at Road Construction Sites
Working at road construction sites (see Glossary) is dangerous. From 2003 to 2015, 1,166 construction workers died at road construction sites, about 90 deaths annually, accounting for approximately 9% of all construction fatalities each year (chart 47a).1 Compared to other major industries, the construction industry experiences a larger burden of deaths at road construction sites. From 2011 to 2015, 429 fatal injuries at road construction sites occurred among construction workers, comprising 70% of all such deaths. This was six times higher than that in transportation, the industry with the second highest number of deaths at these sites (chart 47b).
Workers at road construction sites can be involved in a variety of injury events (see Glossary). Between 2011 and 2015, more than half (52.2%) of road construction deaths were pedestrian vehicular incidents where a worker was struck by a vehicle or mobile equipment (chart 47c). Another 12.6% of road construction fatalities were roadway incidents involving a worker who was operating a vehicle at the time of incident.
Trucks were the top source (see Glossary) of deaths at road construction sites. Between 2011 and 2015, trucks were involved in nearly one-quarter of fatal injuries at road construction sites (23.5%; chart 47d). Passenger vehicles (including automobiles, buses, and passenger vans) were the next most common source, causing 17.5% of construction fatalities at those sites, followed by multipurpose highway vehicles (such as pick-up trucks and SUVs; 16.6%).
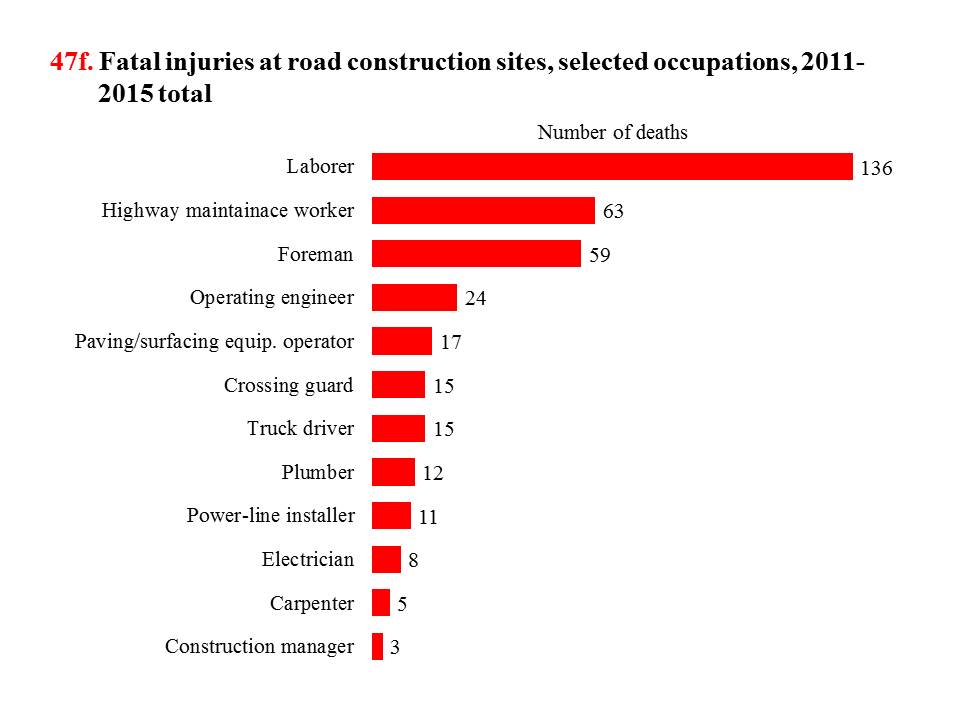
Construction workers exposed to hazards at road construction sites include not only those engaged in road construction work, but also those working in road maintenance and utilities management (e.g., electricity, communications, water, and gas). From 2011 to 2015, 309 workers in the Highway, Street, and Bridge subsector (NAICS 2373) were killed at road construction sites, accounting for 72% of all road construction fatalities during these years. The Utility System Construction subsector (NAICS 2371) ranked second in road construction deaths among construction subsectors (chart 47e). By occupation, 136 construction laborers were fatally injured at road construction sites between 2011 and 2015, more than any other occupation in construction (chart 47f). Highway maintenance workers and foremen also experienced an elevated number of deaths during this time.
According to OSHA, during the peak construction season, approximately 20% of the nation’s highway system is under construction with more than 3,000 work zones.2 As the highway infrastructure in this country ages, rebuilding and improving existing roadways will be more frequent than before.3 To prevent injuries and fatalities at road construction sites, OSHA and NIOSH offer safety training materials and intervention information for workers and employers.4,5 Select safety solutions are also available at the CPWR Construction Solutions Database, NIOSH Motor Vehicle Safety at Work, and the National Work Zone Safety Information Clearinghouse. Moreover, worker safety and road user accessibility should be an integral and high priority aspect of every road project from design to construction.6
(Click on the image to enlarge or download PowerPoint or PDF versions below.)
Glossary:
Road construction sites – Includes construction, maintenance, or utility work on a road, highway, or street based on the definition used in the CFOI data by BLS (Pegula S. 2013. An analysis of fatal occupational injuries at road construction sites, 2003–2010. Monthly Labor Review, November 1-7).
Event – The Event or Exposure describes the manner in which the injury or illness was produced or inflicted by the source of injury or illness, including Transportation Incidents (e.g., a worker on foot being struck by a vehicle that came into the work zone), Contact with Object and Equipment (such as being struck by falling truck beds, struck against moving part of machinery, caught in between parts of a dump truck in a work zone, struck by a backing up vehicle, etc.), and other events (such as fires).
Source – The Source and Secondary Source identify any objects, substances, equipment, or other factors that were responsible for the injury or illness incurred by the worker or that caused the event or exposure.
1. Fatality numbers were estimated from the Census of Fatal Occupational Injuries. This research was conducted with restricted access to the U.S. Bureau of Labor Statistics (BLS) data. The views expressed here do not necessarily reflect the views of the BLS. Calculations by the CPWR Data Center.
2. Construction Safety Council. 2008. Work zone hazards workbook, https://www.osha.gov/dte/grant_materials/fy08/sh-17795-08/workzone_hazards_awareness_english.pdf (Accessed November 2017).
3. American Society of Civil Engineers, https://www.asce.org/ (Accessed November 2017).
4. Occupational Safety and Health Administration. Highway work zones and signs, signals, and barricades, https://www.osha.gov/doc/highway_workzones (Accessed November 2017).
5. National Institute for Occupational Safety and Health. 2017. Highway work zone safety, https://www.cdc.gov/niosh/topics/highwayworkzones/ (Accessed July 2017).
6. U.S. Department of Transportation, Federal Highway Administration. 2009 Edition Chapter 6B, Fundamental principles. Section 6B.01 Fundamental principles of temporary traffic control. https://mutcd.fhwa.dot.gov/pdfs/millennium/pr2/6br2.pdf. (Accessed November 2017).
Note:
All charts – Data cover all employment.
Chart 47a – Other fatalities are fatalities from all causes except at road construction sites.
Chart 47b – Admin. supp. & waste manage: Administrative and Support and Waste Management and Remediation Services (NAICS 56).
Chart 47c – Other includes intentional injuries by person; exposure to temperature extremes; and other event or exposure with numbers that do not meet BLS publication criteria.
Chart 47d – Multi-purpose highway vehicles includes vehicles that can be used either for transport of passengers or of goods and materials as their primary function. Other includes sources with numbers that do not meet BLS publication criteria.
Source:
All charts – Fatality numbers were estimated from the Census of Fatal Occupational Injuries. This research was conducted with restricted access to the U.S. Bureau of Labor Statistics (BLS) data. The views expressed here do not necessarily reflect the views of the BLS. Calculations by the CPWR Data Center.
