Chart Book (6th edition): Industry Summary – Green Construction in the United States
9. Green Construction in the United States
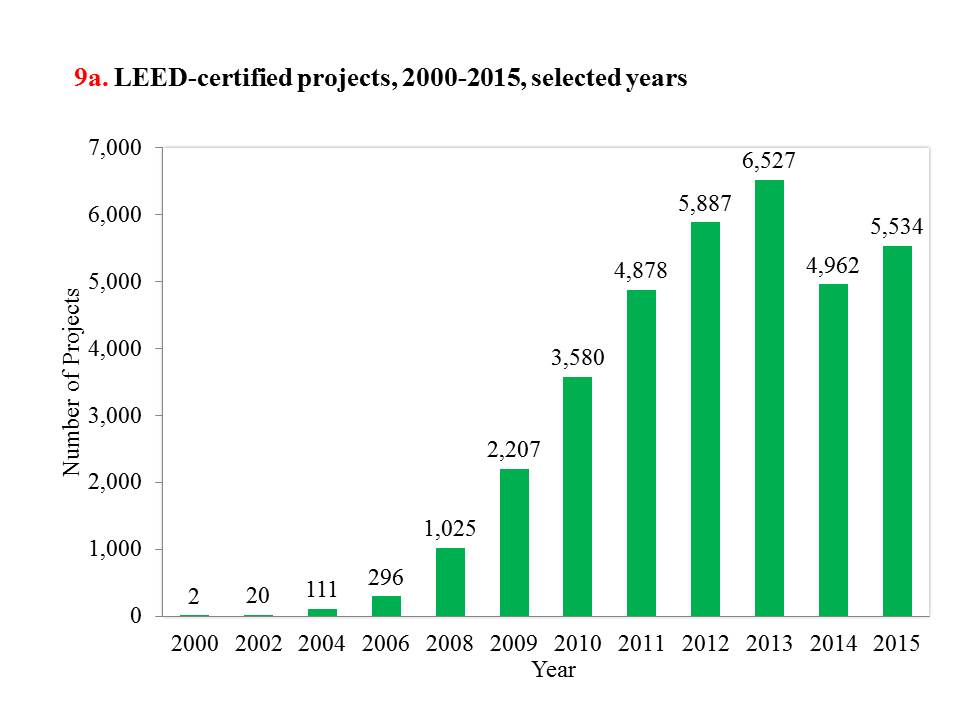
Green products and sustainable designs are used increasingly in the construction industry, in part due to the cost benefits that come from energy efficiency.1 According to the U.S. Green Building Council (USGBC), construction projects with LEED certification2 have increased dramatically in the U.S. market, even during the economic downturn. From 2009 to 2011, the annual number of nonresidential LEED-certified projects in the U.S. more than doubled from 2,207 to 4,878, and reached 6,527 in 2013 (chart 9a). LEED certification declined over the last two years, but has remained high.
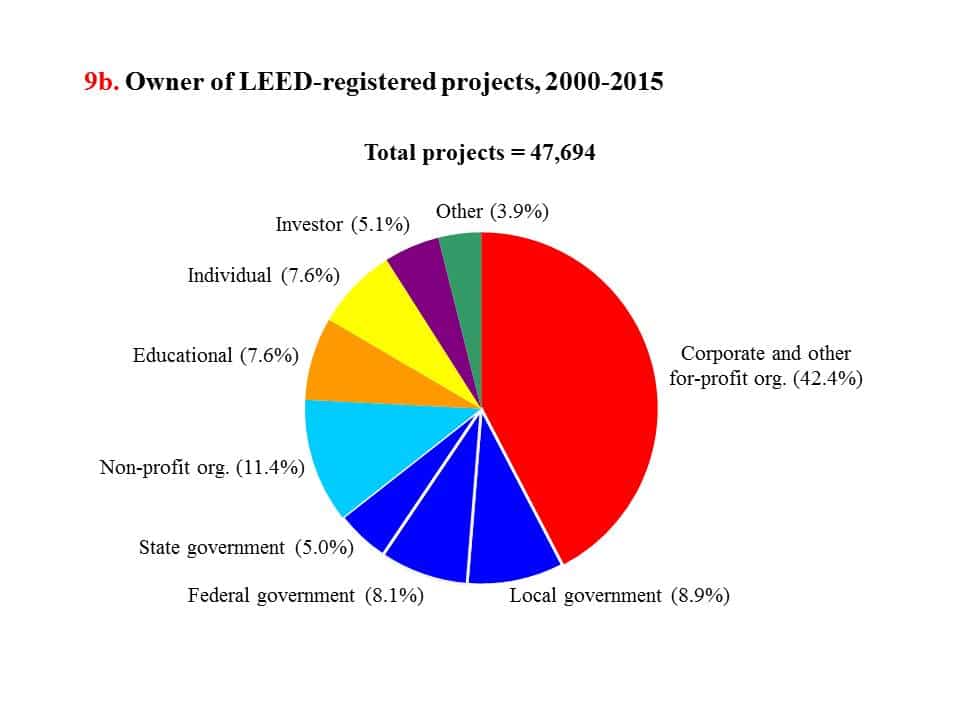
From the adoption of the LEED standard in 2000 through 2015, a total of 70,000 construction projects in the U.S. have been registered with the USGBC, of which more than half (52.6%) have received LEED certification.3 Among the LEED-registered projects (47,694) where owner information is available, 42.4% are owned by corporations and other for-profit organizations (chart 9b). Federal, state, and local governments have contributed significantly to the growth in green building; combined government buildings account for more than one in five LEED-registered projects. The U.S. Government Services Administration (GSA) has also named LEED the most credible rating system available for green projects.4 Accordingly, the GSA increased the minimum requirement for new construction and substantial renovations of federally-owned facilities to LEED Gold. As of June 2016, the GSA owned 154 LEED certified buildings, 49 of which were gold and 10 of which were platinum, the highest rating available. These buildings accounted for 44.6 million square feet, or nearly one quarter of all GSA-owned space.
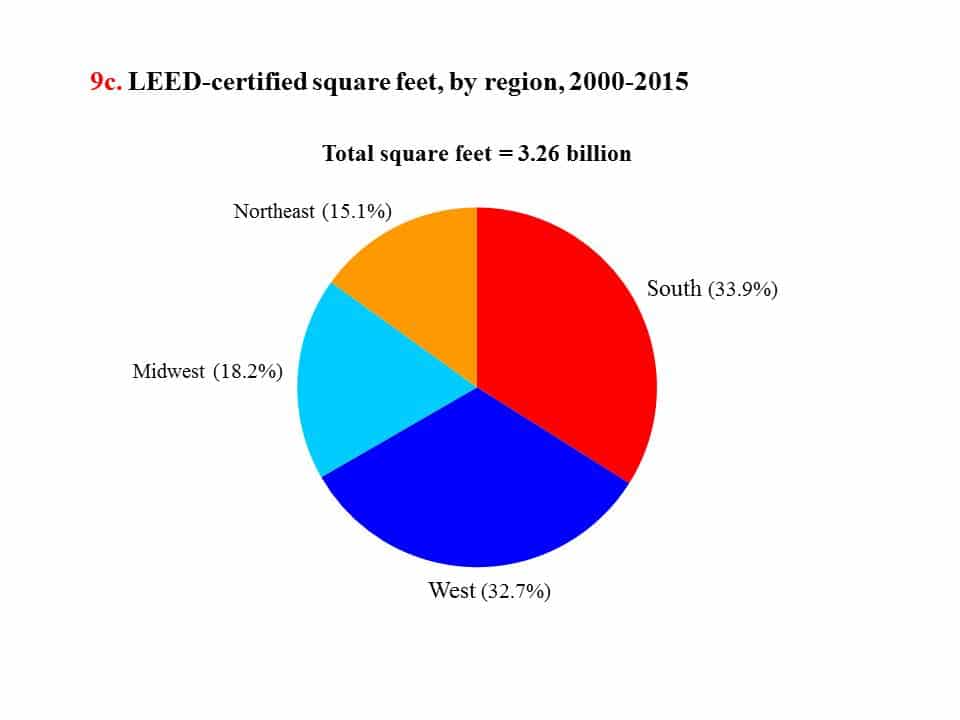
Green construction activity, as measured by square footage, varies by region (see Glossary). Projects in the southern part of the United States accounted for just over one-third (33.9%) of all LEED-certified square feet, followed closely by the West with 32.7% (chart 9c). In contrast, the Midwest and the Northeast had a much smaller proportion of LEED-certified square feet, with 18.2% and 15.1%, respectively. This may be partially due to less construction activity overall in these regions of the country.
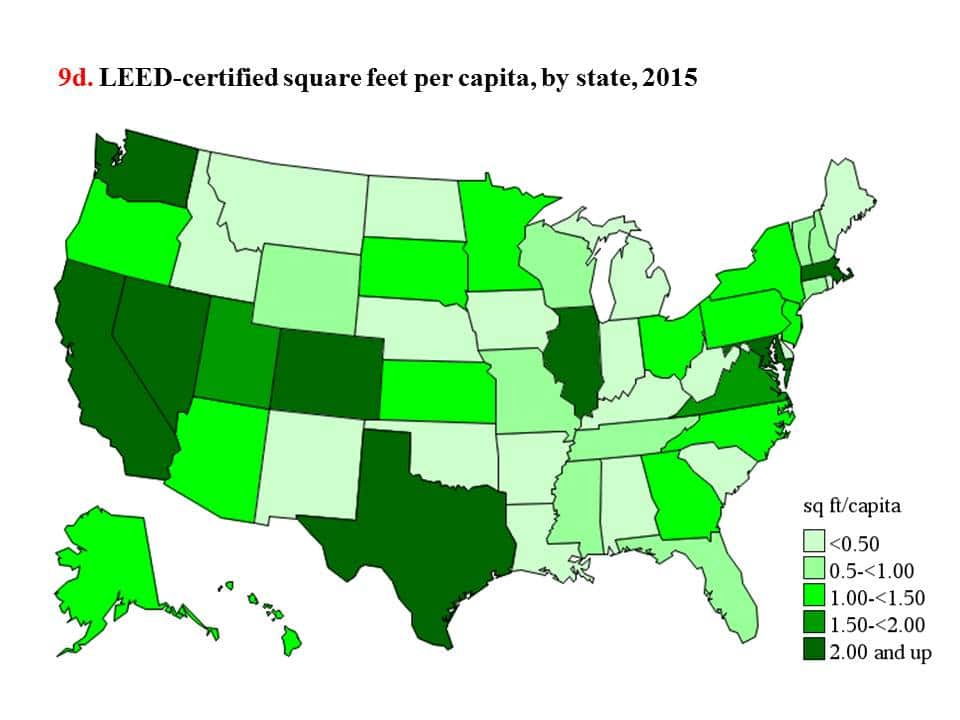
At the state level (including the District of Columbia), in terms of the average square feet per capita (or per person), green construction was distributed unevenly. In 2015, the District of Columbia reported the highest LEED-certified space per capita, at 19.3 square feet (chart 9d). Illinois had the second highest LEED-certified square feet per capita at 3.4, followed closely by Maryland (3.1) and Massachusetts (3.0). The large number of federal government buildings in the District of Columbia likely contributes to the high density of LEED-certified space. However, the District of Columbia as a city may not be directly comparable to other states.
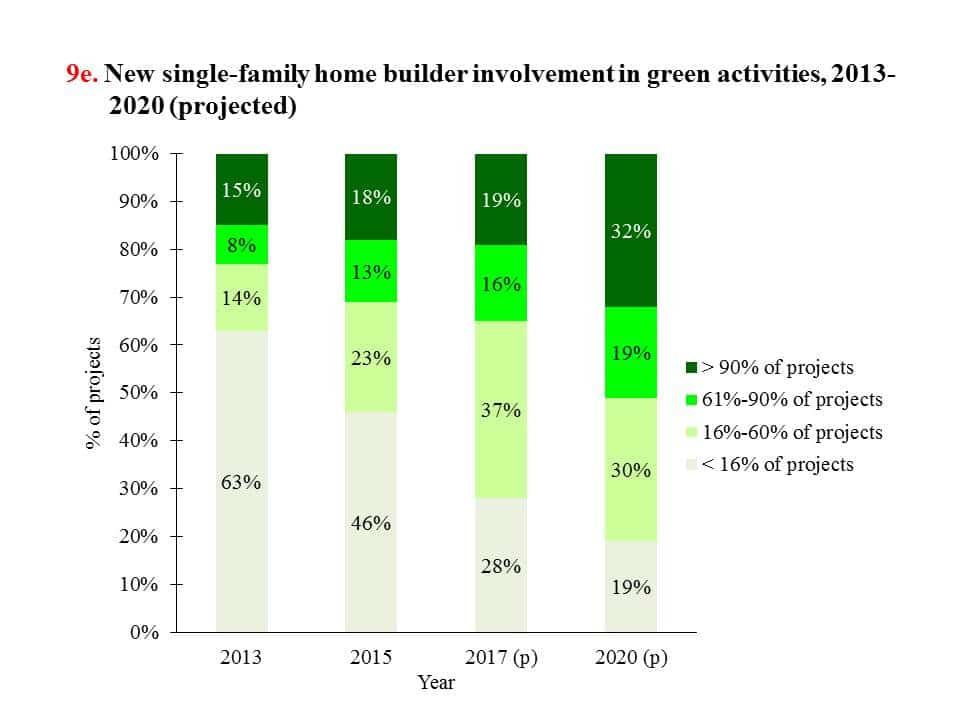
The green trend has been transforming residential construction as well.5 According to Dodge Data & Analytics (formerly known as McGraw-Hill Construction), the proportion of new single-family home builders involved in green construction is projected to increase in the coming years as more builders take on an increasing number of green projects. By 2020, it is estimated that activities for nearly one-third of single-family home builders will be entirely or almost entirely green (chart 9e). By 2030, building energy use could be cut more than 20% using technologies known to be cost effective today.1
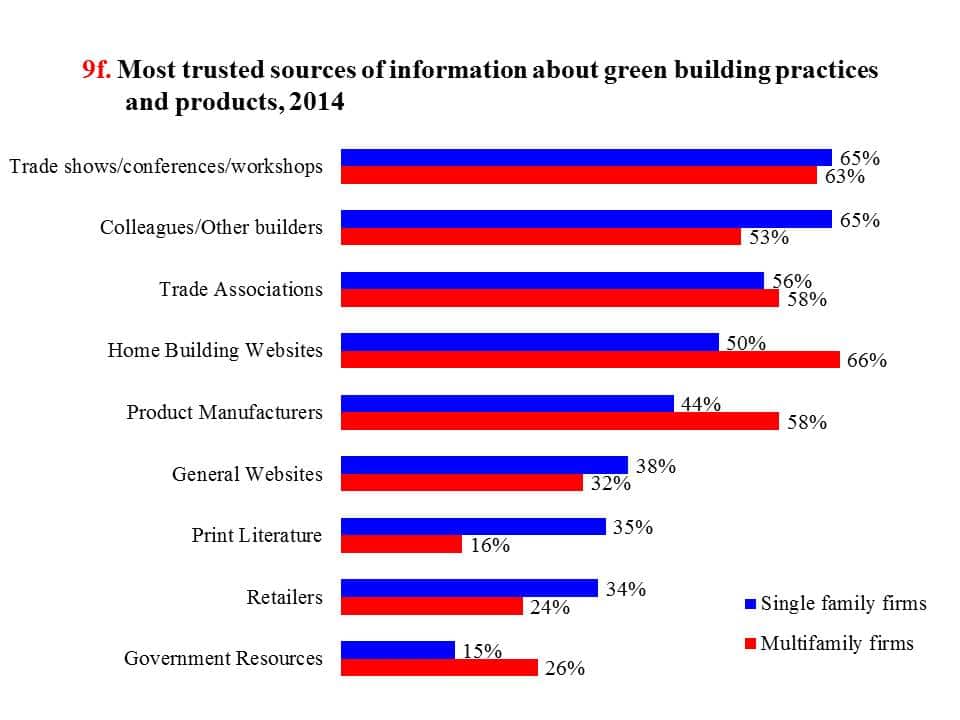
Among the various information sources on green construction, single-family firms are more likely to rely on information from trade shows, conferences, workshops, or colleagues and other builders. In contrast, multifamily firms tend to trust information from homebuilding websites or product manufacturers regarding green building practices and products (chart 9f).
Although green construction is anticipated to benefit the environment and the economy, it is unclear whether it creates new hazards or exacerbates existing hazards for construction workers. Therefore, it is important to promote the NIOSH Prevention through Design (PtD) initiative6 for green construction and sustainable design.
(Click on the image to enlarge or download PowerPoint or PDF versions below.)
Glossary:
Region – The 50 states and the District of Columbia are divided into regions as follows: Northeast (Connecticut, Maine, Massachusetts, New Hampshire, New Jersey, New York, Pennsylvania, Rhode Island, and Vermont); South (Alabama, Arkansas, Delaware, District of Columbia, Florida, Georgia, Kentucky, Louisiana, Maryland, Mississippi, North Carolina, Oklahoma, South Carolina, Tennessee, Texas, Virginia, and West Virginia); Midwest (Illinois, Indiana, Iowa, Kansas, Michigan, Minnesota, Missouri, Nebraska, North Dakota, Ohio, South Dakota, and Wisconsin); and West (Alaska, Arizona, California, Colorado, Hawaii, Idaho, Montana, Nevada, New Mexico, Oregon, Utah, Washington, and Wyoming).
1. U.S. Department of Energy. 2015. An Assessment of Energy Technologies and Research Opportunities. Chapter 5: Increasing Efficiency of Building Systems and Technologies. https://energy.gov/sites/prod/files/2015/09/f26/QTR2015-05-Buildings.pdf (Accessed January 2017).
2. U.S. Green Building Council. LEED (Leadership in Energy and Environmental Design) is a rating system that assigns points to buildings for sustainable site selection, water efficiency, energy usage and atmosphere, sustainable materials and resources, indoor environmental quality, location and proximity to transportation, design innovation, and regional priority. There are four levels of certification, based on the number of points awarded. LEED Certified denotes the minimum number of points earned for certification (40-49 points), followed by LEED Silver (50-59 points), LEED Gold (60-79 points), and LEED Platinum (80+ points), the highest of the four. The standard has been adopted in more than 150 countries since the program was piloted in 1999. https://new.usgbc.org/ and http://www.usgbc.org/articles/green-building-facts 2016 (Accessed August 2016).
3. U.S. Green Building Council. 2016. Public LEED project directory, 2000-2015. http://www.usgbc.org/projects (Accessed May 2016). Calculations by the CPWR Data Center. Does not include residential projects.
4. U.S. General Services Administration. 2016. LEED Building Information. http://www.gsa.gov/portal/category/25999 (Accessed August 2016).
5. Dodge Data & Analytics. 2015. Smart Market Report. Green and Healthier Homes: Engaging Consumers of all Ages in Sustainable Living. https://www.construction.com/about-us/press/green-homes-show-growth-in-a-recovering-market-according-to-new-sm-report.asp (Accessed January 2017)
6. The National Institute for Occupational Safety and Health. 2016. Prevention through Design. https://www.cdc.gov/niosh/topics/ptd/ (Accessed November 2016).
Note:
Charts 9a-9d – LEED residential projects are not included.
Chart 9b – “Other” includes those with multiple types of owners, other government, religious establishments, those listed as other, and those difficult to classify.
Chart 9e – “(p)” represents market projections.
Source:
Charts 9a-9c – U.S. Green Building Council. Public LEED project directory, 2000-2015. http://www.usgbc.org/projects (Accessed May 2016). Calculations by the CPWR Data Center.
Chart 9d – U.S. Green Building Council. Square feet of LEED-certified space, per capita, by state (including the District of Columbia). Contact: Leticia McCadden.
Chart 9e – Dodge Data & Analytics. 2015. Smart Market Report. Green and Healthier Homes: Engaging Consumers of all Ages in Sustainable Living. https://www.nahb.org/~/media/Sites/NAHB/Research/Priorities/green-building-remodeling-development/Green-and-Healthier-Homes%202015.ashx (Accessed January 2017).
Chart 9f – Dodge Data & Analytics. 2014. Smart Market Report. Green Multifamily and Single Family Homes: Growth in a Recovering Market. http://analyticsstore.construction.com/2014GreenHomesSMR?sourcekey=PRESREL (Accessed January 2017).
